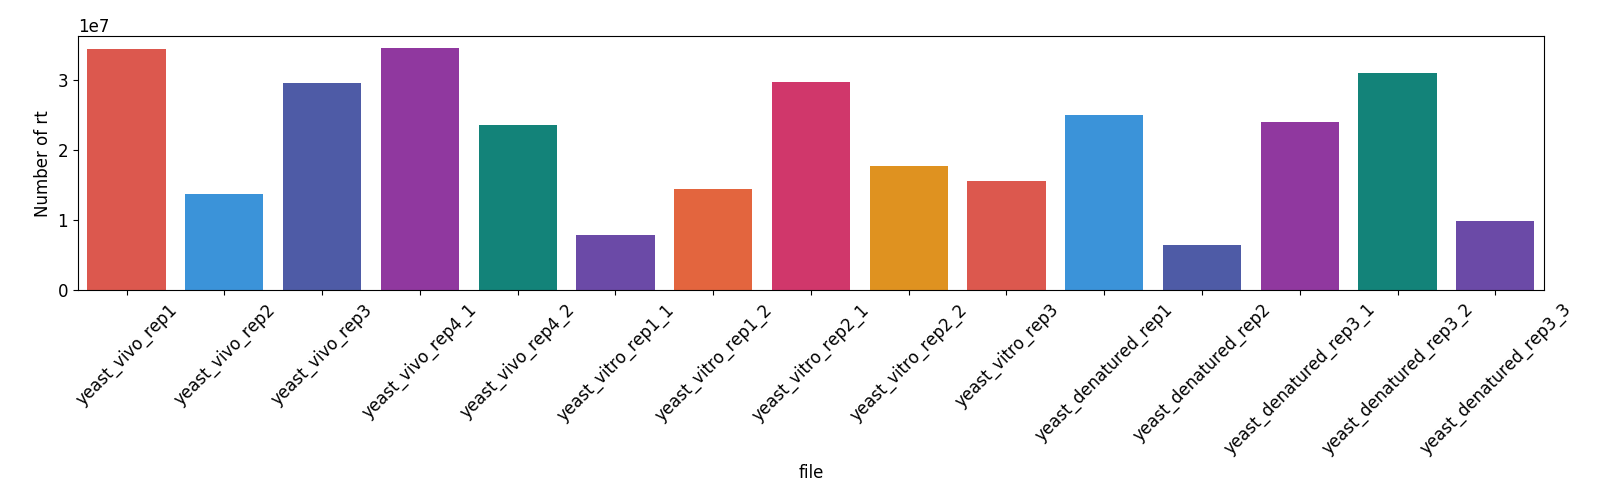
1. Number of RT (Hover to enlarge the figure)
The figure below counts the total number of RTs in each sample.
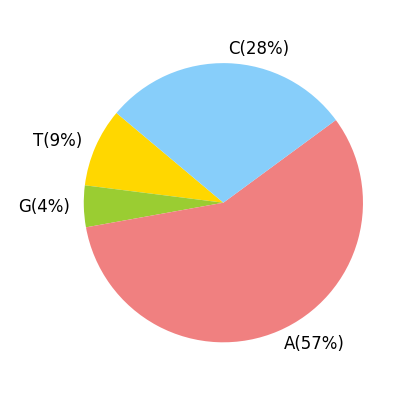
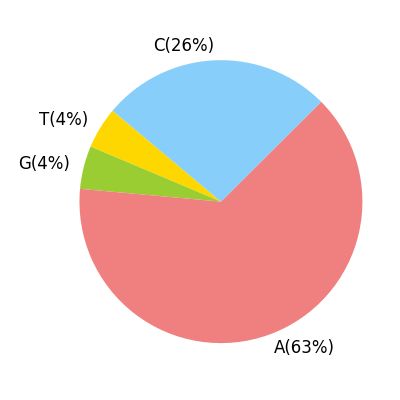
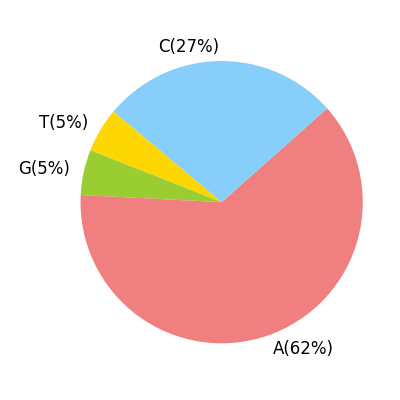
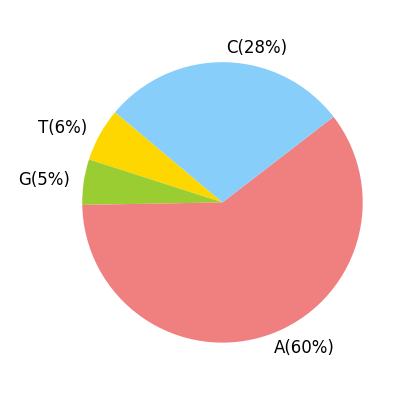
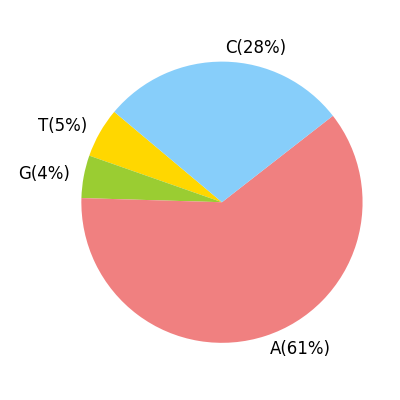
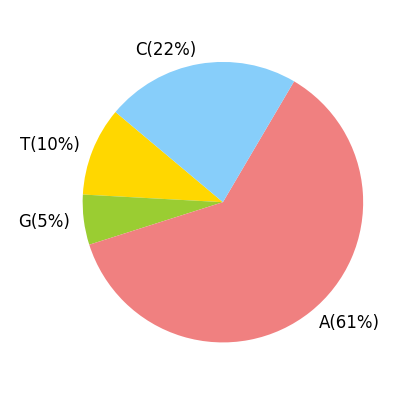
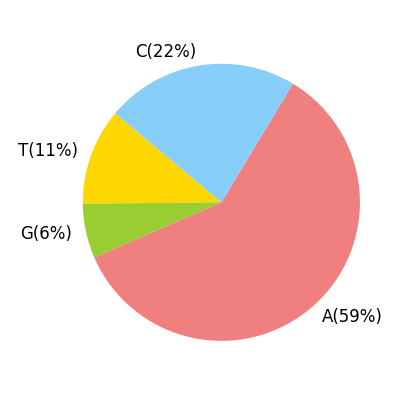
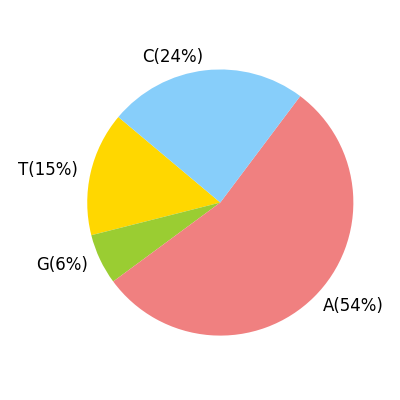
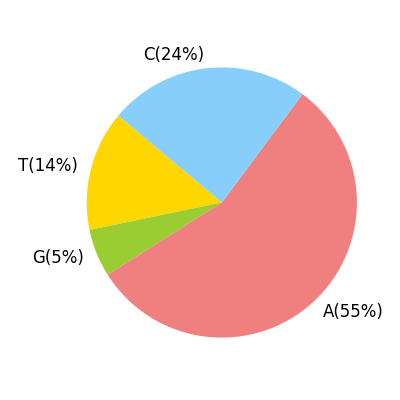
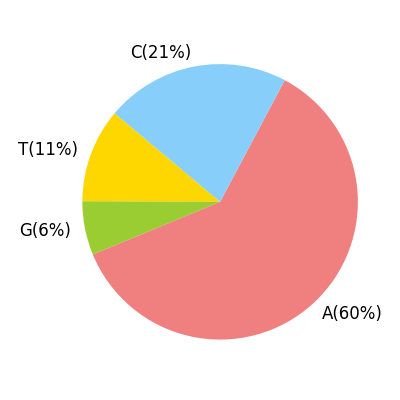
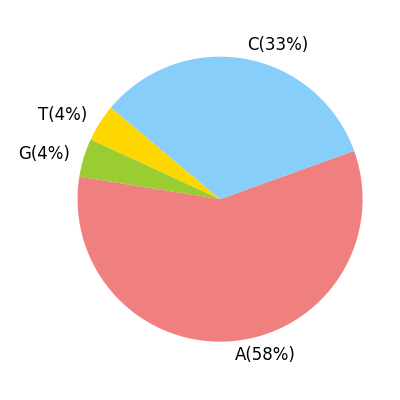
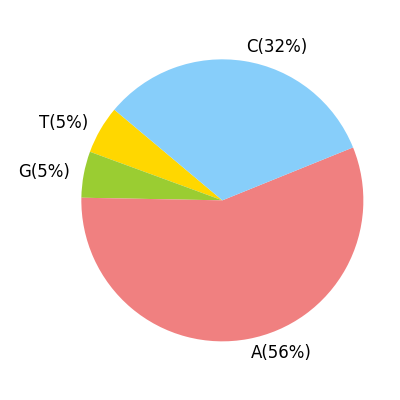
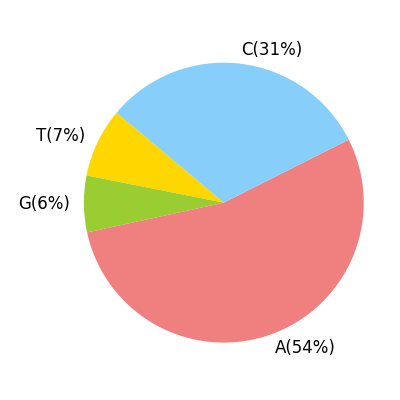
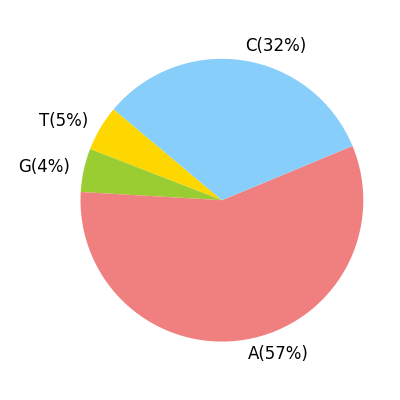
2. Ratio of RT for each base
The figure below shows the RT percentage of each base in each sample.
yeast_vivo_rep1
yeast_vivo_rep2
yeast_vivo_rep3
yeast_vivo_rep4_1
yeast_vivo_rep4_2
yeast_vitro_rep1_1
yeast_vitro_rep1_2
yeast_vitro_rep2_1
yeast_vitro_rep2_2
yeast_vitro_rep3
yeast_denatured_rep1

yeast_denatured_rep2
yeast_denatured_rep3_1
yeast_denatured_rep3_2
yeast_denatured_rep3_3
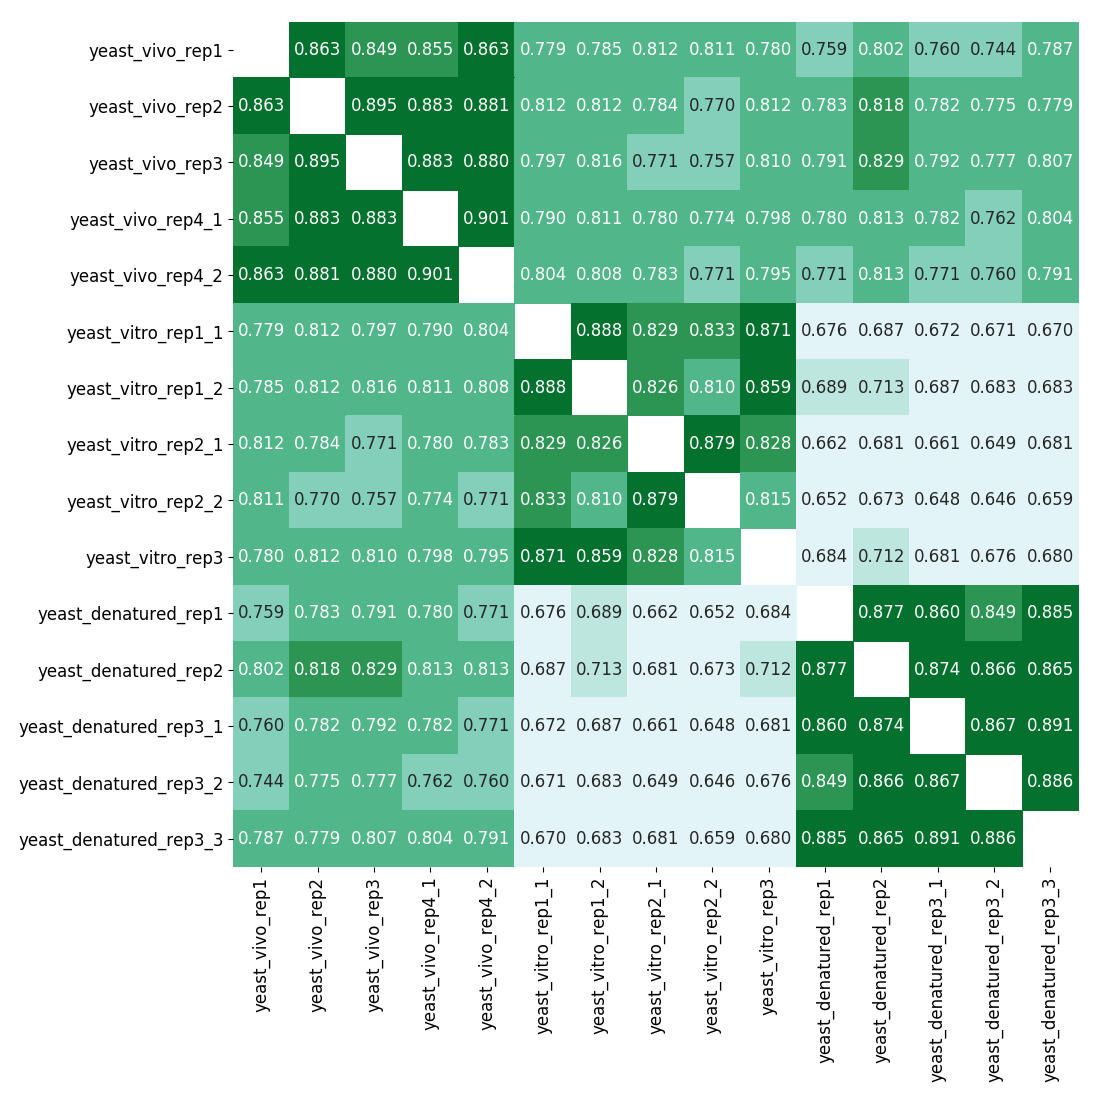
3. Correlation heatmap (Hover to enlarge the figure)
The figure below shows the correlation between the samples. Filter out the bases on the genome with coverage greater than the threshold, slide with a sliding window and calculate the Pearson correlation coefficient for each window