K562_genome_vivo.gtab
command: /Share/home/zhangqf/lipan/usr/icSHAPE-pipe-1.0.0/bin/Functions/plotGenomeSHAPEdist.py -i 8.scores/K562_genome_vivo.gtab -o 9.shape_dist/K562_genome_vivo
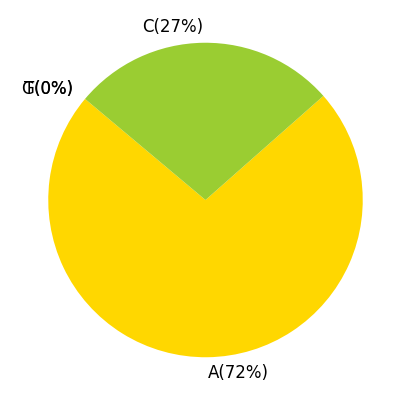
1. Ratio of RT for each base
The figure below shows the RT percentage of each base in each sample.
RT Ratio in treatment samples
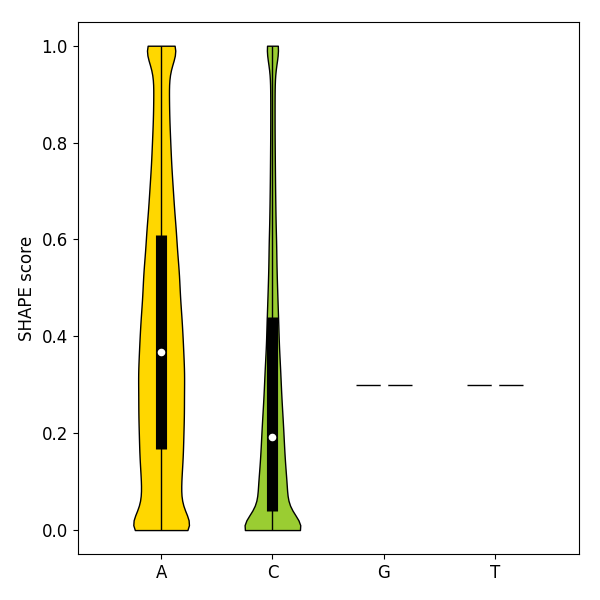
2. Reactivity distribution
The figure below shows the distribution of SHAPE scores for each base.