K562_vivo_rep1_2.sorted.bam
command: /Share/home/zhangqf/lipan/usr/icSHAPE-pipe-1.0.0/bin/Functions/samStatistics.py -i 5.map_genome/K562_vivo_rep1_2.sorted.bam -o SamStatistic/K562_vivo_rep1_2 --fast -g /150T/zhangqf/GenomeAnnotation/Gencode/hg38.genomeCoor.bed
1. Basic Information
There are a total of 266,017,229 reads, and the sample rate is 0.004
2. Mapping of data
The following table and pie chart count the mapping rate of reads and the ratio of mapping to annotated genes and intergenic regions.
| Type | Sampled number | Est. ratio |
|---|---|---|
| exon | 564,917 | 56.48% |
| un-mapped | 248,566 | 24.85% |
| intron | 143,532 | 14.35% |
| intergenic | 42,520 | 4.25% |
| un-annotated | 636 | 0.06% |
3. Mapping on Exon
The table below and the pie chart record the proportion of reads on each gene exon.
| Type | Sampled number | Est. ratio |
|---|---|---|
| protein_coding | 397,467 | 70.36% |
| retained_intron | 70,950 | 12.56% |
| nonsense_mediated_decay | 38,535 | 6.82% |
| processed_transcript | 37,711 | 6.68% |
| lincRNA | 10,039 | 1.78% |
| antisense | 3,300 | 0.58% |
| processed_pseudogene | 3,027 | 0.54% |
| misc_RNA | 648 | 0.11% |
| Mt_rRNA | 629 | 0.11% |
| TEC | 443 | 0.08% |
| sense_intronic | 394 | 0.07% |
| unprocessed_pseudogene | 309 | 0.05% |
| snRNA | 239 | 0.04% |
| transcribed_unprocessed_pseudogene | 205 | 0.04% |
| non_stop_decay | 177 | 0.03% |
| sense_overlapping | 174 | 0.03% |
| Mt_tRNA | 152 | 0.03% |
| snoRNA | 126 | 0.02% |
| transcribed_processed_pseudogene | 109 | 0.02% |
| ribozyme | 75 | 0.01% |
| 3prime_overlapping_ncRNA | 63 | 0.01% |
| non_coding | 32 | 0.01% |
| transcribed_unitary_pseudogene | 19 | 0.00% |
| miRNA | 17 | 0.00% |
| unitary_pseudogene | 17 | 0.00% |
| macro_lncRNA | 16 | 0.00% |
| scaRNA | 14 | 0.00% |
| rRNA | 11 | 0.00% |
| IG_V_pseudogene | 3 | 0.00% |
| pseudogene | 2 | 0.00% |
| TR_V_pseudogene | 1 | 0.00% |
| IG_V_gene | 1 | 0.00% |
4. Mapping on Intron
The table below and the pie chart record the proportion of reads on each gene intron.
| Type | Sampled number | Est. ratio |
|---|---|---|
| protein_coding | 90,585 | 63.11% |
| processed_transcript | 17,174 | 11.97% |
| nonsense_mediated_decay | 12,543 | 8.74% |
| lincRNA | 10,105 | 7.04% |
| retained_intron | 7,343 | 5.12% |
| antisense | 4,743 | 3.30% |
| transcribed_unprocessed_pseudogene | 297 | 0.21% |
| unprocessed_pseudogene | 257 | 0.18% |
| sense_overlapping | 255 | 0.18% |
| sense_intronic | 77 | 0.05% |
| non_stop_decay | 54 | 0.04% |
| transcribed_unitary_pseudogene | 36 | 0.03% |
| transcribed_processed_pseudogene | 24 | 0.02% |
| processed_pseudogene | 16 | 0.01% |
| unitary_pseudogene | 6 | 0.00% |
| 3prime_overlapping_ncRNA | 5 | 0.00% |
| bidirectional_promoter_lncRNA | 4 | 0.00% |
| IG_V_pseudogene | 1 | 0.00% |
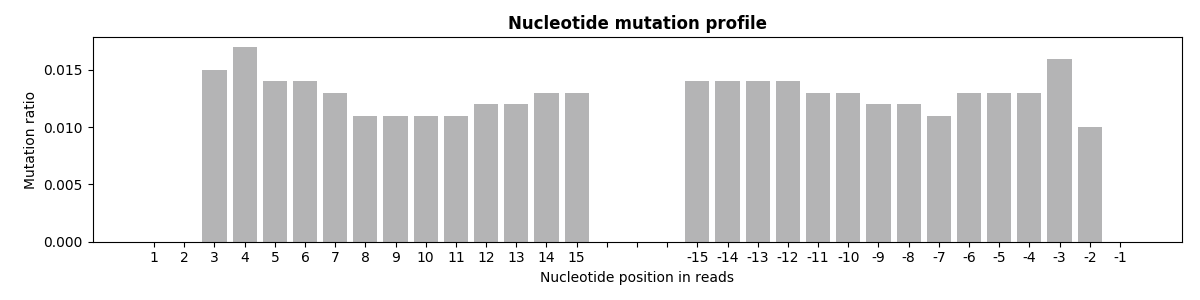
5. Reads mutation profile
The histogram below shows the average mutation rate of each base on the map region of reads.
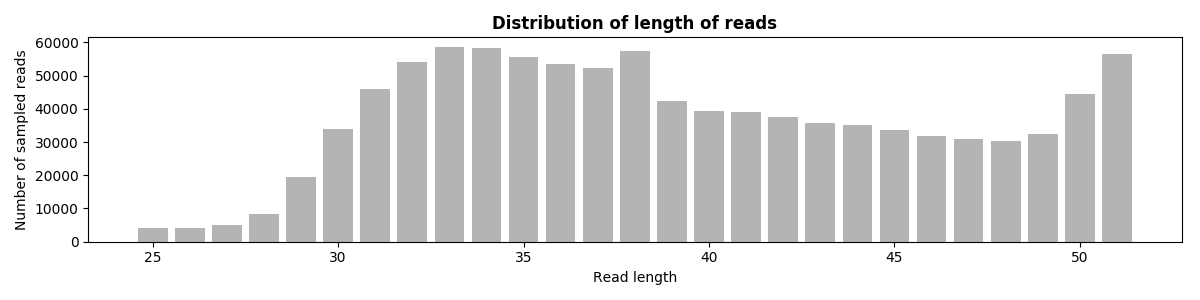
6. Reads Length
The figure below shows the distribution of the sampled read length.