K562_genome_vivo.out
command: /Share/home/zhangqf/lipan/usr/icSHAPE-pipe-1.0.0/bin/Functions/transSHAPEStatistics.py -i 10.trans_scores/K562_genome_vivo.out -o 13.trans_score_analysis/K562_genome_vivo -g /150T/zhangqf/GenomeAnnotation/Gencode/hg38.genomeCoor.bed
1. Number of transcript
The table below counts the number of transcripts for each type of gene.
| Type | Number | Ratio |
|---|---|---|
| protein_coding | 10,958 | 61.24% |
| retained_intron | 2,838 | 15.86% |
| processed_transcript | 2,232 | 12.47% |
| nonsense_mediated_decay | 1,141 | 6.38% |
| lincRNA | 233 | 1.30% |
| antisense | 181 | 1.01% |
| processed_pseudogene | 145 | 0.81% |
| sense_intronic | 24 | 0.13% |
| snoRNA | 22 | 0.12% |
| non_stop_decay | 17 | 0.10% |
| misc_RNA | 15 | 0.08% |
| snRNA | 14 | 0.08% |
| TEC | 12 | 0.07% |
| unprocessed_pseudogene | 11 | 0.06% |
| transcribed_unprocessed_pseudogene | 11 | 0.06% |
| transcribed_processed_pseudogene | 9 | 0.05% |
| Mt_tRNA | 9 | 0.05% |
| sense_overlapping | 7 | 0.04% |
| scaRNA | 4 | 0.02% |
| 3prime_overlapping_ncRNA | 3 | 0.02% |
| rRNA | 2 | 0.01% |
| Mt_rRNA | 2 | 0.01% |
| pseudogene | 1 | 0.01% |
| ribozyme | 1 | 0.01% |
| IG_V_gene | 1 | 0.01% |
2. Number of bases
The table below counts the number of bases for each type of gene.
| Type | Number | Ratio |
|---|---|---|
| protein_coding | 10,551,037 | 79.11% |
| retained_intron | 1,171,759 | 8.79% |
| nonsense_mediated_decay | 715,530 | 5.36% |
| processed_transcript | 682,411 | 5.12% |
| lincRNA | 106,203 | 0.80% |
| antisense | 66,623 | 0.50% |
| processed_pseudogene | 13,605 | 0.10% |
| sense_intronic | 8,047 | 0.06% |
| TEC | 5,266 | 0.04% |
| non_stop_decay | 4,164 | 0.03% |
| sense_overlapping | 1,921 | 0.01% |
| transcribed_unprocessed_pseudogene | 1,789 | 0.01% |
| transcribed_processed_pseudogene | 1,593 | 0.01% |
| unprocessed_pseudogene | 1,574 | 0.01% |
| Mt_rRNA | 1,261 | 0.01% |
| misc_RNA | 1,160 | 0.01% |
| 3prime_overlapping_ncRNA | 956 | 0.01% |
| snoRNA | 927 | 0.01% |
| snRNA | 556 | 0.00% |
| scaRNA | 270 | 0.00% |
| pseudogene | 173 | 0.00% |
| Mt_tRNA | 159 | 0.00% |
| ribozyme | 141 | 0.00% |
| IG_V_gene | 108 | 0.00% |
| rRNA | 61 | 0.00% |
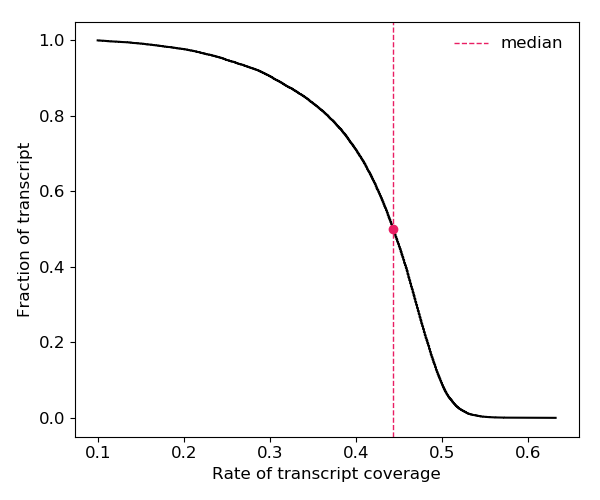
3. Coverage of transcript
The figure below shows the distribution of the coverage of the reactivity score on transcripts.
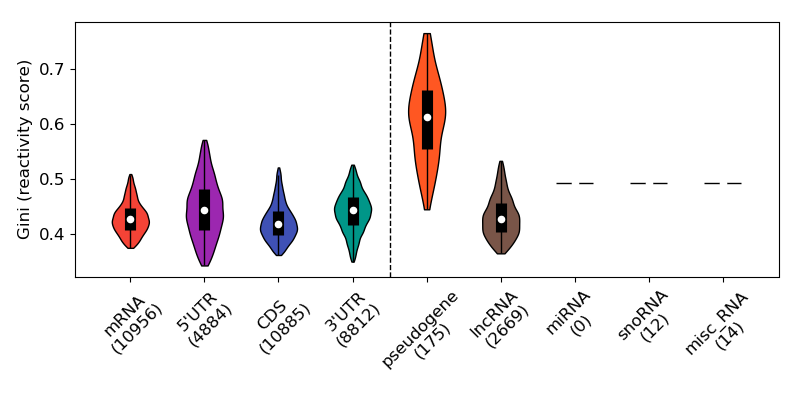
4. Gini index
The figure below shows the distribution of the Gini Index for each type of RNA.
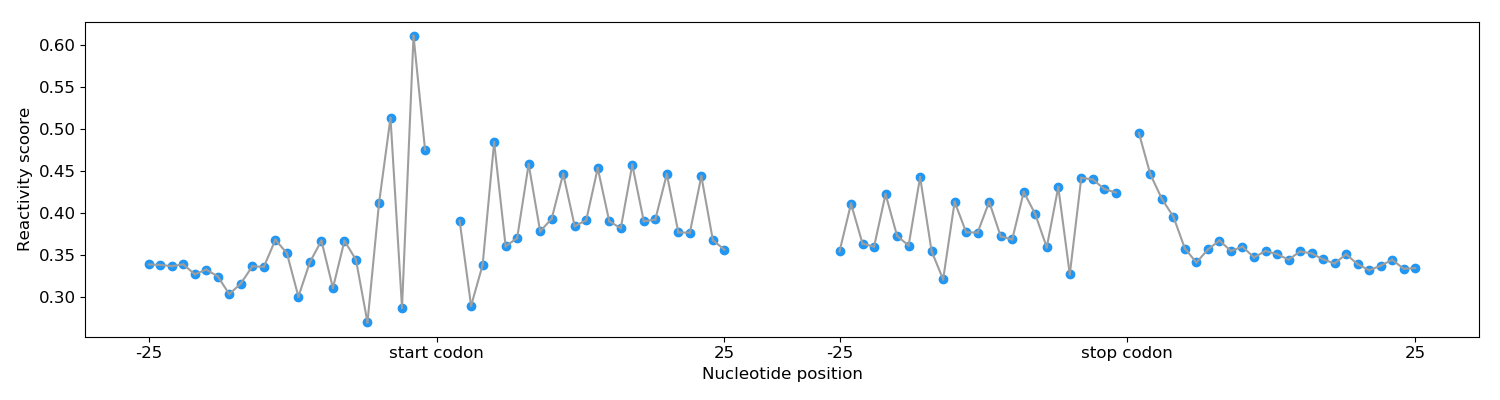
5. Periodicity
The figure below shows The periodicity of the reactivity score around the start codon and the stop codon.